

When searching for flights, a lot of people, especially casual travelers, tend to look for the best possible flights according to several criteria, such as the price, the duration or the airline companies. There are lots of ressource out there explaning how to find single-objective shortest paths, but not much on how to optimize when there are multiple objectives to optimize, for example minimizing both the price and the duration. The purpose of this serie of three posts is to explain how to :
- Load, clean the dataset and migrate it from MySQL to Neo4j
- Design multi-stops flights routes using Neo4j graph database
- Find shortest paths while optimizing two multiple objectives
Starting point
This project is done in collaboration with Ctrip, the Chinese leading provider of travel services. The starting point is a dataset (a 4 Gigabytes CSV file) which contains flights records from the Ctrip website. These records are in fact the results returned by the website, from people who are searching for flights within the year of 2017. Each record contains various information related to the trip such as the departure time, the seat class, the flight code, the price of the whole trip etc. The dataset has a total of 38 columns and more than 9 millions of records and represent the search results within the first three months of 2017. For confidentiality reason, the dataset is not provided, but here is how it looks like:
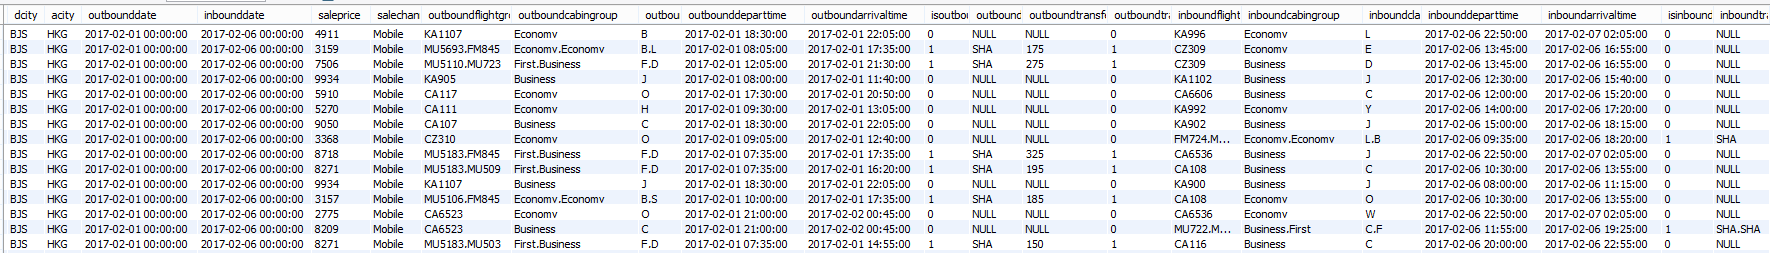
Fig 1 - Example of the flights information dataset, displayed with MySQL Workbench
Note: each row represents the whole trip that is, including all transfer airports, including the inbound flights when the trip is a round-trip. The price is the price of the entire trip (single or round-trip). When there are transfers during the trip, the field departureairports or departuretimes has multiple values seperated by a comma.
Data loading
Given the size of the file, it's not conceivable to use the CSV file to do analysis and processing. The first step is then to load the data into a relationship database, and MySQL was chosen because it's an open source project and easy to use that provides an official GUI. Why relational database? Because of the nature of the CSV file, it contains data in row form and is suitable for a preliminary data investigation. The data can loaded either by a wizard importation (really slow, takes hours for a few gigabyte of data) or by using the LOAD DATA INFILE built-in function which only takes about 20 minutes to load the whole dataset. But using this method, I have to specify beforehand the schema of the dataset. One thing to be careful is the type of columns fields. For example, there's a column called departuretimes which contains the departure times for every flight in the entire trip. Instinctively, I would use the datetime type for it, but this column in fact contains a list of departure times separated by a comma, so by using the datetime type, only the first element of the list is loaded without any warning or error. This, later led to some incoherence, so instead, I used the VARCHAR type (string type).
Data cleansing
After running some SQL queries top the dataset, I noticed that the dataset contains some incoherence and errors. So in order to work with a clean dataset that won't later lead to misinterpretation, I have to clean the dataset. Here are some cleansings that have been done:
- Deleted around 200 rows that have a price strictly lower than 193 Yuan (~25\$). Indeed, results show us that these flights are only direct flights that connect BJS airport (Beijing) to NYC airport (New York), and the price is absurdly low.
- Same thing done with absurdly high price: a plot of the price distribution shows that the highest price is around 200 000 Yuan, but there are 18 rows containing a price higher than 10 000 000 Yuan.
- Deleted around 20 rows with negative value for the transfer time.
- Deleted rows that contain flights whose interval between departure date and arrival date lasts more than one week.
- Deleted rows that transfers in the same airport more than once.
- The columns outboundtranscounts and inboundtransfercounts are supposed to count the number of transfer, but the value in the dataset has only two values: either 0 or 1, even when there are more than one transfer. So I updated the table by using the number of comma in the outboundcabingroup column, which has value like 'Economy,Business,Economy", so here, it means that the entire outbound trip has 2 transfers. An easy to do that in SQL is:
UPDATE flights
SET inboundtransfercounts = LENGTH(inboundcabingroup) - LENGTH(REPLACE(inboundcabingroup, ',', ''))
WHERE inboundcabingroup != 'NULL'
Amongst the 38 columns, not all of them are useful for our model, so there are columns that remained untouched.
Price estimation for flight segments
The price given in the dataset is the price for the whole trip. Each row represents a trip that contains all the flights taken during the trip. A round-trip is represented as a single row, which makes somehow the analysis process difficult.
In order to turn our problem into a graph search problem, I have to connect fights 'segments' between different trips, and use price for each flight segment as a weight that can be summed.
One of the challenge faced when designing our model is the price estimation of these flights segments. Flight price estimation is a really challenging problem in the real-world because so many factors influence the price such as the timing of purchase, the competition, availability of empty seats, the day of the week, the price of oil etc...
A first but vain attempt to estimate the price was to use the distance between two airports. This distance was calculated by using the Haversine formula and the longitudes and latitudes of the both airport. These longitudes and latitudes can be found on openFlights.org, an open source website that provides flights and airports related information for almost all airports in the world. The useful information they I extracted are the latitude, longitude and the airport IATA code (like CDG that stands for Charles De Gaulle). This estimation even when considering the seat class, is not precise and ignores too many factors.
So instead, I am going to estimate price for a given trip based on the data itself. Indeed, since the dataset are the results from different people searching on the Ctrip website at different timing, there are the same trip with different price. I then calculate the median of these price. The advantage of this method is that it takes into account many factors such as the airline company, the seat or the trip date automatically since the estimation is based on historical data.
Given the size of the dataset, running multiple queries with multiple filters and aggregation takes a lot of time and is not easily visualizable.
Therefore, I use Tableau Software to do the analysis by connecting it to our MySQL database. The advantage of using this, is that it really enhances the running time and queries written in MySQL is updated in Tableau using the refresh feature. I used a feature in Tableau called Tableau Data Extract (.tde file), which consists of producing a compressed version (from 4 gigabytes to 340 megabytes!) of the MySQL database and turns into a columnar storage. When doing aggregation on only one column (like calculating the median of the price), the columnar storage only goes through the specific column, making the computing really fast, whereas the relation database has to go through each row, and then fetch the value of the column of interest. The following figure explains the difference between these two models.
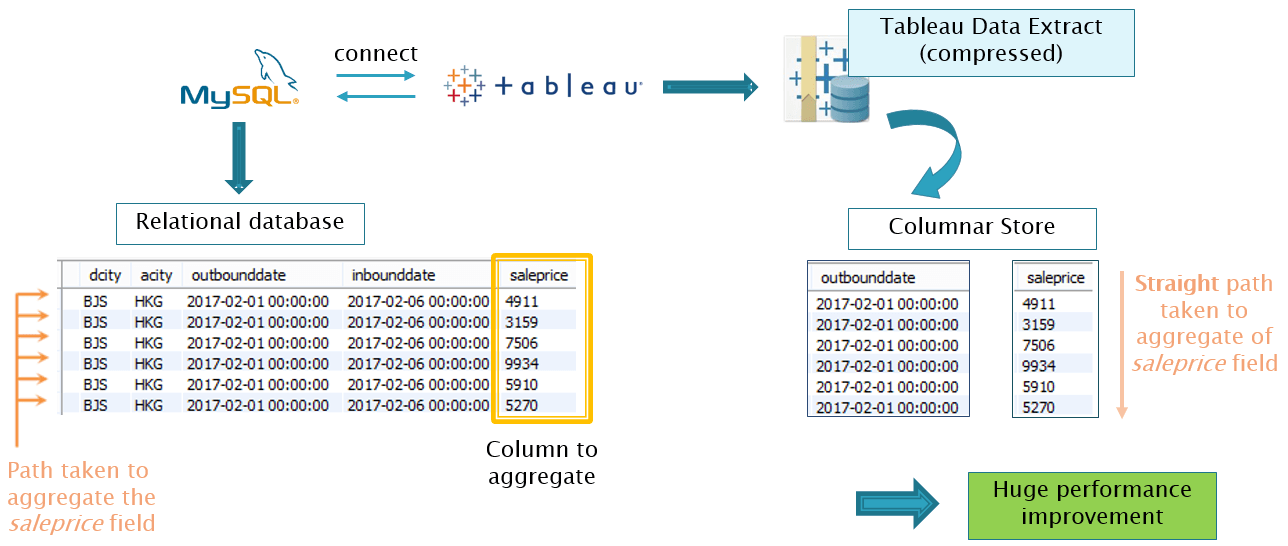
Figure 2 - Using Tableau Data Extract over MySQL and Tableau connection
I then used the departure date, value of fields like the airline company, the seat, the outbound and inbound transfer counts as filters to distinguish between different origin and destination airports as shown in the following figure.
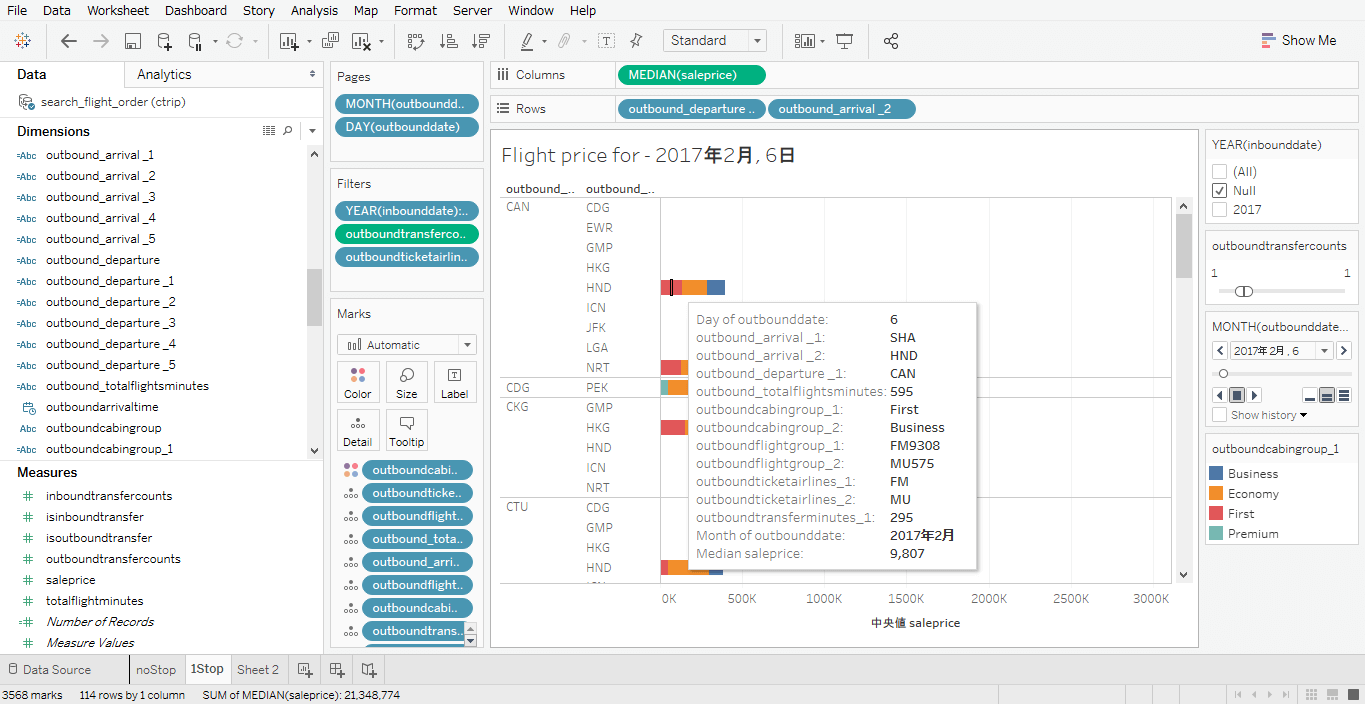
Figure 3 - Example of filtering by fields in Tableau
Alternatively, the flight information can just be put inside the Detail marks. I obtained then the median price filtered by date, airline company, seat and route.
Afterward, I export the workbook data for further processing, the exported format is a .mdb file (Microsoft Access database format) and not a CSV file since there are "pages" created but filtering by the departure date. Here, Bullzip MS Access to MySQL is used to convert the .mdb file into a .sql script that will load the data exported from Tableau to a MySQL table.
However, at this stage, the median price computed by Tableau is still associated to the whole trip, I now simply parition the price of the trip between each segment proportionally based on the flight segment duration. The dataset provides departure and arrival time in local time, so it's difficult to compute the duration due to the problem of the time zone and the DST (Daylight Saving Time, where clocks are set ahead of standard time during part of the year usually buy 1 hour). Fortunately, there is a Python library, called Pendulum, which takes all of these factors into account to compute the duration. The crucial information needed for this, is the Time Zone for each airport. For example, CDG’s time zone is “Europe/Paris”. Once again, thanks to openflights.org, the open source flights and airports data provides a dataset which contains the time zone associated to each airport. I have then written a function to compute the actual flight duration between an airport source and an airport target.
Now that the dataset is ready, we are ready to populate the Neo4j graph database.
Data structure in Neo4j
Neo4j's graph data structure involves three main things: label, relationship and pattern. A node is the representation of an object such as a person, an airport, a file etc. For instance, a 'person' node car can have multiple label such: Person, Engineer, Manager etc... Nodes are associated with at least one label and might have properties such as 'name', 'location', 'birthday' and represent a thing.
A relationship is what connects nodes. To simplify the image, it can be seen as the edge in a graph and a node is a vertex. Relationships might have properties or not, and can be directed or not. The type of a relationship is in general a word describing a verb. The following figure illustrates the basic concept of data structure in Neo4j with flights and airports example:
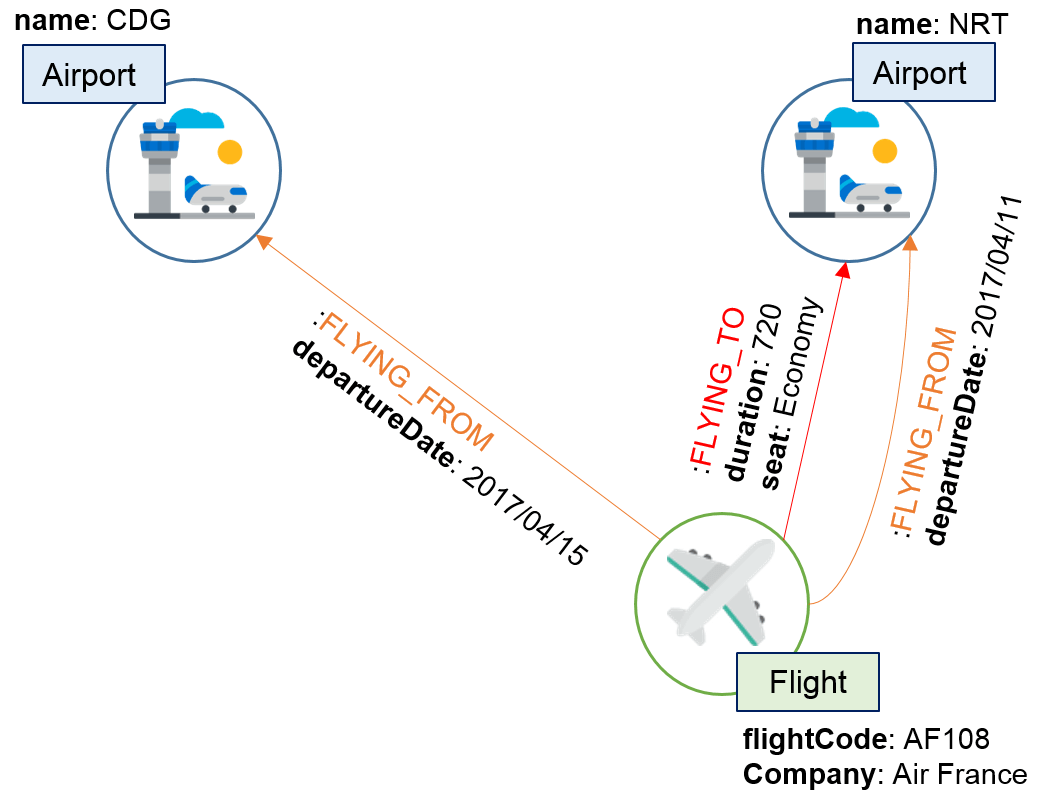
Figure 4 - Example of a flight routes modeling with Neo4j data structure
Pattern and matching-pattern is the core concept of Neo4j when it comes to writing query. Patterns allow to describe to shape of the data you are query against. The description of patterns is done using the Neo4j query language: Cypher. Cypher is a query language for Neo4j inspired by SQL. The syntax is visually really similar to the way the graph was modeled. For example, to find all flights that departs from the airport CDG to the airport NRT, the query is:
MATCH (:Airport{name:'CDG'})<-[:FLYING_FROM]-(f:Flight)-[:FLYING_TO]
                ->(:Airport {name:'NRT'})
RETURN f LIMIT 100
Populating Neo4j database
Migrating from the MySQL database to Neo4j won't be done simply by loading the data, we have to indeed structure nodes and relationships wisely, fetch the desired MySQL field data to put inside a node or relationship property etc...
I use py2neo which is a Python client library and toolkit for working with Neo4j, to write script to populate the graph. How to write the exact Cypher depends on how your MySQL table is structured. As an example, here's how the code looks like to populate trips with 2 flights, that is, 1-stop trips:
from py2neo import Graph

def createOneStopNoIboundRoute(graph):
  graph.run("CREATE INDEX ON :Flight(flightCode)")
  graph.run("CREATE INDEX ON :Airport(airportName)")
  data = fetchallData("SELECT * FROM flights")
  query = '''
    MERGE (orig:Airport {airportName: {orig}})
    MERGE (dest:Airport {airportName: {dest}})
    MERGE (transfer:Airport {airportName: {transfer}})
    MERGE (f1:Flight{flightCode:{flightCode1}})
    MERGE (f2:Flight{flightCode:{flightCode2}})
    WITH orig, dest, transfer, f1, f2
    CREATE (orig)-[:HAS_FLIGHT{departure_time:{departure_time1}}]->
(f1)-[:TO{departure_time: {departure_time1}, arrival_time:{arrival_time1}, seat: {seat1}, price: {price1}, duration: {duration1}}]->
(transfer)-[:HAS_FLIGHT{departure_time:{departure_time2}}]->
(f2)-[:TO{departure_time: {departure_time2}, arrival_time:{arrival_time2}, seat: {seat2}, price: {price2}, duration: {duration2}}]->(dest)
  '''
  for row in data:
    parameters = {
      'orig': row['departureairports_out - Split 1'],
      'dest': row['arrivalairports_out - Split 2'],
      'transfer': row['departureairports_out - Split 2'],
      'seat1': row['outboundcabingroup - Split 1'],
      'seat2': row['outboundcabingroup - Split 2'],
      'flightCode1': row['outboundflightgroup - Split 1'],
      'flightCode2': row['outboundflightgroup - Split 2'],
      'price1': row['time_price_1'],
      'price2': row['time_price_2'],
      'duration1': row['real_duration_1'],
      'duration2': row['real_duration_2'],
      'departure_time1': row['departuretimes_out - Split 1'],
      'arrival_time1': row['arrivaltimes_out - Split 1'],
      'departure_time2': row['departuretimes_out - Split 2'],
      'arrival_time2': row['arrivaltimes_out - Split 2'],
    }
    graph.run(query, parameters)

graph = Graph()
createOneStopNoIboundRoute(graph)
Creating index on a specific node's property allows faster search when querying, and here I suppose that you have written a simple function to fetch all data from your MySQL database. The essential part is the Cypher query, here I write a straigforward query which connects the very first airport orig in the trip to the first flight f1 with the HAS_FLIGHT relationship. Then, f1 is connected to the transit airport transfer with the TO relationship, which then has a flight f2 which flies to the final destination airport dest.
This script is only just for information purposes. Writing the correct Cypher query to populate your Neo4j graph database will really depend on how you design your problem. Designing multi-transfers flights is kind of complex given that we also have to consider the perfomance issue and optimizing the query time. Therefore, in the second post of this serie of three posts, I will explain the different models that I've experimented and have been through before leading to the satisfying final model.
For the complete code, please check my GitHub repository.


© 2020, Philippe Khin